In an age of censorship and intimidation, skilled people use social media anonymously in order to protect their livelihoods whilst getting the message out. Fountainhead is one such analyst. Here’s their latest, taken from the New Zealand Ministry of Health data, with my rusty interpretation of what it means.
Chart 1: Screenshot from 4,143 lines of MoH data. 79% of the NZ population are at least partially injected, so 21% of the population declined all doses despite the levels of propaganda and force, including loss of job.
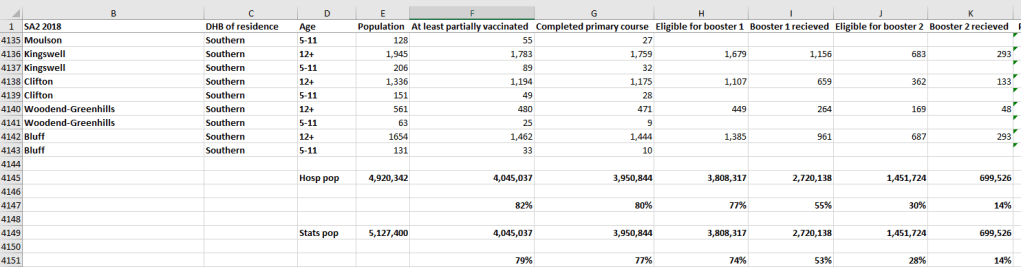
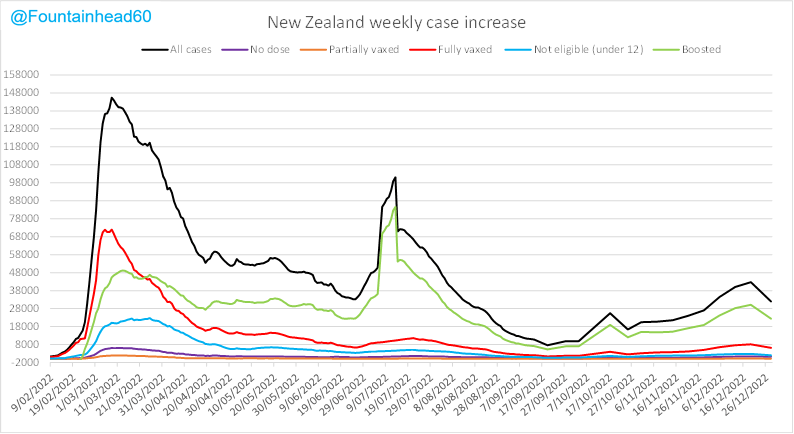
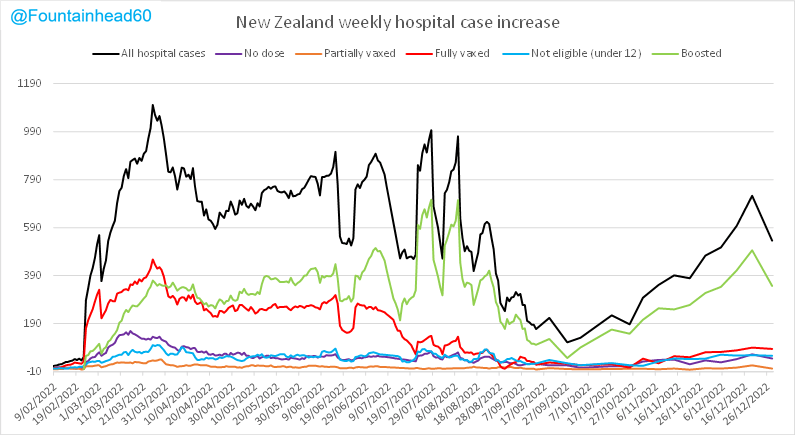
Chart 2: In comparison with 21% total uninjected population, the proportion of uninjected new Covid cases is 3.72% and the proportion of Covid related new hospitalisations who have had zero doses is 8.4%. By comparison 89.3% of new cases are either “fully vaccinated” or “boosted”, and they make up 80.6% of new Covid related hospitalisations. Proportionally the unvaccinated make up far fewer cases and hospitalisations using the testing regime sold as a diagnostic tool.

Graphs using this government supplied data follow. This is not how a vaccine is supposed to impact a population.
Increase in New Cases: The boosted make up 70% of new cases. Which is probably due to multiple factors including the fact that spike protein circulating in one’s system (as occurs post-inoculation) can lead to a positive test result, in those who are unwell but also the healthy who are testing. This may be because those who believe they need to receive repeat “vaccines” also believe that testing regularly is useful/diagnostic, and those not vaccinated may be less likely to use the tests. After a booster, more people become unwell if exposed to Covid (and other infections), due to immune suppression.
New Hospitalisations: The boosted make up almost 65% of New Zealand’s new Covid positive hospitalised cases whilst only 55% of the population has taken a booster. The more doses someone has had, the more immune-suppressed they become.
The difference between unvaccinated new cases (3.7%) and unvaccinated new hospitalisations (8.4%) may be explained by a difference in testing, with unvaccinated at home less likely to test but unvaccinated admitted to hospital required to test. It may also be that a higher proportion of unvaccinated who are exposed to Covid, become sick. There may be other explanations as well.
It’s also important to note that “unvaccinated” includes anyone whose injection was administered less than 14 days ago, meaning that a proportion in the “unvaccinated” group are in fact, inoculated. This obscures multiple statistics, especially in hospitalisation and mortality data relating to people who have been recently inoculated.
Regardless of the alarming safety signals, this is not an effective vaccine.
This has been a clown show. Below is a montage from America’s biggest clown. Every nation has equivalents of him, almost all of them recipients of the multi billion dollars that he distributes worldwide, and all of them have dominated mainstream media through this.
Dr Ryan Cole describes it as scientific fraud of the most astounding kind, calling for criminal liability and compensation to those harmed.
Safety signals regarding cancer are seeing oncologists included in the growing number of specialists speaking out.

There are multiple safety signals regarding young people dying suddenly, with working age populations contributing to excess death data in 2022.